Difference between revisions of "A Productive Desktop Environment for Scientists and Engineers - Part II"
| Line 124: | Line 124: | ||
</nowiki></pre>. | </nowiki></pre>. | ||
[[Image:gmt-hello-world.gif|thumb|300px|Hello, World!]] | [[Image:gmt-hello-world.gif|thumb|300px|Hello, World!]] | ||
Similar to the previous tools that we discussed in these pages, here also, we don't attempt to cover the basics of GMT here. Our purpose is to get the flavour of the tool, after having a comfortable computing environment to try it out. After that, we may look at the [http://gmt.soest.hawaii.edu/gmt/doc/html/GMT_Docs/GMT_Docs.html GMT Cookbook], [http://gmt.soest.hawaii.edu/gmt/gmt_man.html GMT man pages] and the [http://gmt.soest.hawaii.edu/gmt/doc/html/tutorial/tutorial.html GMT tutorial]. | |||
Before going to a bit more complex example, let's go through the GMT command we have used to create this image. | |||
#The purpose of pscoast command is obvious, it draws coastlines. But, it can draw, political boundaries (as we did), major and minor rivers and many other linear features. | |||
# <tt>-JM10c</tt> says to draw a map of width 10cm, in Mercator(M) projection. | |||
# <tt>-R</tt> indicates the limits of the map. | |||
# <tt>-B</tt> specifies the frame styles, annotations, titles etc. | |||
# <tt>-G</tt>, <tt>-W</tt>, <tt>-N1</tt>, for what to draw in the map and what colors to use. | |||
# finaly, we write the output to the Postscript file named <tt>world.ps</tt>. | |||
===A much involved example=== | |||
One of the strengths of the GMT tools is the ability of superimposing a number of geological datasets to produce an informative map. We'll domonstrate this feature by plotting a map of island of Sri Lanka with a bit of the surrounding ocean and overlaying the map with a GFAS rainfall map (the one we have used in a [A_Productive_Desktop_Environment_for_Scientists_and_Engineers_-_Part_I#Two_dimensional_data_sample previous chapter]). | |||
When we overlay several maps, we have to use the special options <tt>-O</tt> and <tt>-K</tt> | |||
* -O says 'we are writing on to a map previously started by other command(s).' | |||
* -K says 'we will write more to this map in later command(s).' | |||
Rather than doing our task in a single script, let's complete it in several steps for better understanding. | |||
[[Image:gmt-grid-line-registration.png|thumb|301px|Grid line registration{{subscript|source:GMT documentation}}]] | |||
[[Image:gmt-pixel-registration.png|thumb|301px|Pixel registration{{subscript|source:GMT documentation}}]] | |||
# Get the data and transform it to a GMT format. For 2-D data, GMT has an efficient binary format known as 'grd format'. We shall start with the file Sample-spatial.txt (that we have created [A_Productive_Desktop_Environment_for_Scientists_and_Engineers_-_Part_I#Two_dimensional_data_samplebefore].) The xyz2grd utility creates a grd file from text data. <nowiki> | |||
</nowiki><pre><nowiki> | |||
xyz2grd Sample-spatial.txt -Z -R30/90/-60/60 -I0.25/0.25 -F -Gss.grd | |||
</nowiki></pre> | |||
#* -Z : indicates we are processing a file with only z values (not x,y,z triplets) | |||
#* -I : The grid spacing in x and y (longitude and latitude) directions. | |||
#* -F : our data is in [http://gmt.soest.hawaii.edu/gmt/doc/html/GMT_Docs/node151.html pixel registration], rather than default, [http://gmt.soest.hawaii.edu/gmt/doc/html/GMT_Docs/node150.html grid line registration]. | |||
---- | ---- | ||
[[Category:Computing]][[Category:Learn]] | [[Category:Computing]][[Category:Learn]] | ||
Revision as of 11:34, 30 April 2006
GIS ? ... Not quite!
Recently many have fallen into the the habit of throwing around the term Geographical Information System (or much cooler GIS) as if it is something we eat for our lunch everyday! While these are extremely useful tools for many advanced applications in different fields, often one does not need a full-fledged GIS system to achieve many targets related to processing of spatial data.
Personally I found that more than 50% of the tasks I had to do with spatial datasets could be realized using tools far less complicated than a complete GIS system. There are a number of software products that can be used to draw beautiful maps and also to perform some basic spatial data analysis tasks. We shall learn to use one of them in this chapter.
- Note
- It is important that we have a basic knowledge on the tools like cygwin, Unix commands, shell scripting, awk, sed, etc. Therefore it is necessary to complete the previous section, before attempting this one.
GMT - The Generic Mapping Tools
GMT is an open source collection of ~60 tools for manipulating geographic and Cartesian data sets (including filtering, trend fitting, gridding, projecting, etc.) and producing Encapsulated PostScript File (EPS) illustrations ranging from simple x-y plots via contour maps to artificially illuminated surfaces and 3-D perspective views. GMT supports ~30 map projections and transformations and comes with support data such as coastlines, rivers, and political boundaries.
One of the strong points of the GMT tools is that it has an excellent set of documents, which includes a tutorial, comprehensive manual pages on each command and a cook-book of real-world examples (GMT Documentation). Further, there is a very active GMT mailing list. This should be the forum to ask questions that are beyond the basic set of documents.
The biggest weak point of GMT is that each of its 60 odd commands have extensive list of arguments, that are hard to remember and even harder to use accurately. But, then this is a problem of any advanced computer tool -- there are no simple solutions for complex problems!
In this pages, we shall first explore a simple example or two using the hard way; then learn how to lessen the pain of scripting by taking some shortcuts. Finally we will go through some fairely complicated examples.
Installation
There are numerous ways of arriving at the target of a usable GMT installation. Even, GMT can work on Windows. However, my advice is to use it on a Unix environment. Since we already have a functional Cygwin environment, that's where we start.
There is a page on the GMT site, that explains in detail, the installation procedure. However, for the first time user it can be a bit complicated (particularly due to the general nature). Let's go step by step.
- in cygwin
mkdir /usr/local/GMT #create a directory for installation cd /usr/local/GMT
- Download the installation script.
wget ftp://ftp.soest.hawaii.edu/gmt/install_gmt
- Go to GMT install form.
- Change only the following values:
- Select archive format: bzip2
- Select default PostScript output format for GMT: Encapsulated PostScript (EPS)
- Select the appropriate netCDF library option: Please get and install netCDF 3.6 (Give full pathname to the netCDF directory: /usr/local/netCDF)
- Select the components you want (gzip/bzip2 sizes indicated): <Click all>
- Select the C compiler you want to use: gcc
- Select supplemental packages to install: unselect MEX
- Submit the form and save the resulting form as GMTparam.txt at c:
- Change only the following values:
cygwin\usr\local\GMT using the Save As menu of the web browser.
- in cygwin
cd /usr/local/GMT bash install_gmt GMTparam.txt
- The installation will take a fair amount of time depending on your computer hardware and level of network connectivity. If everything has gone smoothly the sript will exit with a message like the following. (some lines removed.)
GMT installation complete. Remember to set these: ----------------------------------------------------------------------- .. .. For sh or bash users: export NETCDFHOME=/usr/local/netCDF export GMTHOME=/usr/local/GMT/GMT4.1.1 export PATH=/usr/local/GMT/GMT4.1.1/bin:$PATH For all users: Add /usr/local/GMT/GMT4.1.1/man to MANPATH Add /usr/local/GMT/GMT4.1.1/www/gmt/gmt_services.html as browser bookmark -----------------------------------------------------------------------
- Now add the required environment variables to /etc/bashrc file using a text editor:
- GMT environment settings
export NETCDFHOME=/usr/local/netCDF export GMTHOME=/usr/local/GMT/GMT4.1.1 export PATH=/usr/local/GMT/GMT4.1.1/bin:$PATH export MANPATH=$MANPATH:/usr/local/GMT/GMT4.1.1/man
- GMT environment settings end.
EOF
- Finally, close cygwin windows, open one again.. and you are done.
Additional programs
To fully enjoy the GMT, we need the following two free utilities.
- ghostscript & gv
- Imagemagick
All these are available as standard packages of cygwin. (i.e. can be installed automatically using cygwin setup.exe.) They are listed under Graphics category. Install these before proceeding to the next section. One can test
Test your installation
Ghostscript, gv and Imagemagick
- First test gv.
- Try viewing any postscript file with gv command. (You can download one from here. Don't forget to expand it before trying the following!)
bunzip2 Sample-postscript.ps.bz2 gv sample-postscript.ps &
If everything is shipshape with ghostscript and gsview, you should see a window with a graphic image. See this page for further details on this program.
- Then, Imagemagick
/bin/convert Sample-postscript.ps sample.png
If there are no complains, try viewing the resulting png file, sample.png by opening it with your web browser. If the image looks fine, then we are done with Imagemagick! Have a look at the imagemagick documentation.
GMT Tools
In fact, the GMT tools have been already tested by the installer. There are a number of examples that come with GMT and the installer run each of them (unless we opt not to in the install form). The folder /usr/local/GMT/GMT4.1.1/examples should have a number of sub folders named ex01, ex02 and so on and each of them should have a postscript file named example_0n.ps. View them using gv.
A flavour of GMT
Now, lets try some simple GMT commands ourselves. One of the most simple commands is minmax:
- First let's create a simple text file with several numerical values (this example has three columns wih four values in each):
$ cat << SOMEFLAG > test.txt -2 3 5 -8 -1 5.5 0 2 6 1 1 1 SOMEFLAG
- now try minmax on the data file
$ minmax test.txt
which will give the result:
test.txt: N = 4 <-8/1> <-1/3> <1/6>
The meaning of this result should be obvious. It says, there are four rows of values, and prints the min/max value pairs for each column.
Hello, World! -- GMT sytle
Always make it a habit to consult the GMT manual pages when you want to use a command. (They are automatically installed in your computer when you install GMT.)
Let's keep up the tradition and start with writing the famous 'Hello, World!' program in GMT. But, we'll do that in style!
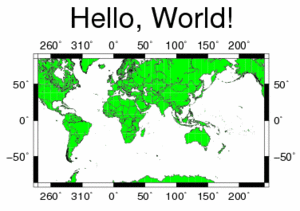
$ pscoast -JM10c -R-120/240/-70/70 -B50:."Hello, World!": -G0/255/0 -N1 -W > world.ps
Have a look at the resulting PostScript file with gv:
$ gv world.ps
.
Similar to the previous tools that we discussed in these pages, here also, we don't attempt to cover the basics of GMT here. Our purpose is to get the flavour of the tool, after having a comfortable computing environment to try it out. After that, we may look at the GMT Cookbook, GMT man pages and the GMT tutorial.
Before going to a bit more complex example, let's go through the GMT command we have used to create this image.
- The purpose of pscoast command is obvious, it draws coastlines. But, it can draw, political boundaries (as we did), major and minor rivers and many other linear features.
- -JM10c says to draw a map of width 10cm, in Mercator(M) projection.
- -R indicates the limits of the map.
- -B specifies the frame styles, annotations, titles etc.
- -G, -W, -N1, for what to draw in the map and what colors to use.
- finaly, we write the output to the Postscript file named world.ps.
A much involved example
One of the strengths of the GMT tools is the ability of superimposing a number of geological datasets to produce an informative map. We'll domonstrate this feature by plotting a map of island of Sri Lanka with a bit of the surrounding ocean and overlaying the map with a GFAS rainfall map (the one we have used in a [A_Productive_Desktop_Environment_for_Scientists_and_Engineers_-_Part_I#Two_dimensional_data_sample previous chapter]).
When we overlay several maps, we have to use the special options -O and -K
- -O says 'we are writing on to a map previously started by other command(s).'
- -K says 'we will write more to this map in later command(s).'
Rather than doing our task in a single script, let's complete it in several steps for better understanding.
- Get the data and transform it to a GMT format. For 2-D data, GMT has an efficient binary format known as 'grd format'. We shall start with the file Sample-spatial.txt (that we have created [A_Productive_Desktop_Environment_for_Scientists_and_Engineers_-_Part_I#Two_dimensional_data_samplebefore].) The xyz2grd utility creates a grd file from text data.
xyz2grd Sample-spatial.txt -Z -R30/90/-60/60 -I0.25/0.25 -F -Gss.grd
- -Z : indicates we are processing a file with only z values (not x,y,z triplets)
- -I : The grid spacing in x and y (longitude and latitude) directions.
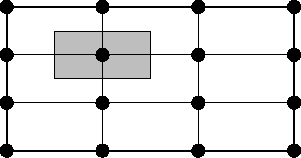
- -F : our data is in pixel registration, rather than default, grid line registration.


