Difference between revisions of "Webapps with python"
| Line 70: | Line 70: | ||
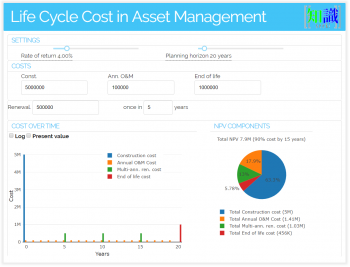
This app provides a convenient way to play with different cost components and interest rates (that is needed to calculate PV) and understand how that affects the whole life cost. | This app provides a convenient way to play with different cost components and interest rates (that is needed to calculate PV) and understand how that affects the whole life cost. | ||
===[http://oro. | ===[http://oro.srv.pathirana.net Orographic lift of wind fields - atmospheric quantities calculator]=== | ||
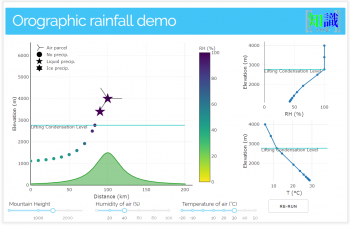
<div style="overflow: hidden">[[File:orographic_lifting_tool_python.png|thumb|center|350px|Atmospheric quantities with orographic uplift [http://oro. | <div style="overflow: hidden">[[File:orographic_lifting_tool_python.png|thumb|center|350px|Atmospheric quantities with orographic uplift [http://oro.srv.pathirana.net/ LINK]]]</div> | ||
This is an educational tool to demonstrate the interaction of wind fields with mountains. The user can change the mountain height, humidity and temperature of the air and observe how they contribute to the formation of precipitation (liquid or sometimes ice/snow). | This is an educational tool to demonstrate the interaction of wind fields with mountains. The user can change the mountain height, humidity and temperature of the air and observe how they contribute to the formation of precipitation (liquid or sometimes ice/snow). | ||
| Line 112: | Line 112: | ||
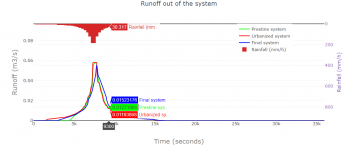
<div style="overflow: hidden">[[File:web2py swmm interface.png|thumb|center|350px|SWMM model results under different catchment conditions [https://web2py.pathirana.net/urbangreenblue/default/index LINK]]]</div> | <div style="overflow: hidden">[[File:web2py swmm interface.png|thumb|center|350px|SWMM model results under different catchment conditions [https://web2py.pathirana.net/urbangreenblue/default/index LINK]]]</div> | ||
===[https://rwh1. | ===[https://rwh1.srv.pathirana.net/ Calculating Rainwater Harvesting Potential for Small Islands]=== | ||
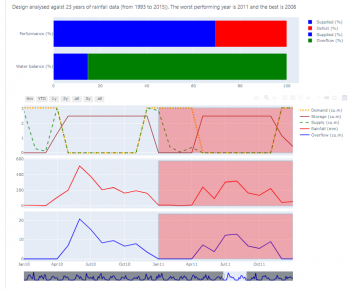
The user provides several input parameters: roof area over which the rainwater is collected, the size of tank planned and the demand – how much water is planned to be used for how many months (e.g. during dry period). Based on user’s location the tool will automatically select historical rainfall data from the nearest meteorological station. Then it simulates the harvesting and usage performance for several decades. Such calculations involving multiple years (for the Maldives this can be about 20-30 years in most cases) gives much better indication of the working of a rainwater harvesting system than just assessing it against one or two years of data. Like many other climates of the world the climate of the Maldives also shows great deal of ‘inter-annual’ variability. Simulations involving a longer period therefore gives a more realistic picture of the performance of the system in the backdrop of such variability. | The user provides several input parameters: roof area over which the rainwater is collected, the size of tank planned and the demand – how much water is planned to be used for how many months (e.g. during dry period). Based on user’s location the tool will automatically select historical rainfall data from the nearest meteorological station. Then it simulates the harvesting and usage performance for several decades. Such calculations involving multiple years (for the Maldives this can be about 20-30 years in most cases) gives much better indication of the working of a rainwater harvesting system than just assessing it against one or two years of data. Like many other climates of the world the climate of the Maldives also shows great deal of ‘inter-annual’ variability. Simulations involving a longer period therefore gives a more realistic picture of the performance of the system in the backdrop of such variability. | ||
<div style="overflow: hidden">[[File:rwh calculator results.png|thumb|center|350px|Rainwater harvesting calculator results.[https://rwh1. | <div style="overflow: hidden">[[File:rwh calculator results.png|thumb|center|350px|Rainwater harvesting calculator results.[https://rwh1.srv.pathirana.net/ LINK]]] </div> | ||
[https://rwh1. | [https://rwh1.srv.pathirana.net/ LINK] | ||
===[https://infil1. | ===[https://infil1.srv.pathirana.net/ Groundwater recharge calculator]]=== | ||
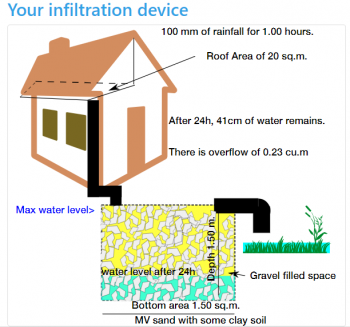
The tool allows the user to choose this by providing the hourly rainfall rate and number of hours over which that intensity will continue. After providing the size of the infiltration pit, whether it is filled with gravel or just empty and the surrounding soil type, the user can calculate the performance of the system. The results are provided as a graphic as well as graph of water level in the structure and any overflow. | The tool allows the user to choose this by providing the hourly rainfall rate and number of hours over which that intensity will continue. After providing the size of the infiltration pit, whether it is filled with gravel or just empty and the surrounding soil type, the user can calculate the performance of the system. The results are provided as a graphic as well as graph of water level in the structure and any overflow. | ||
<div style="overflow: hidden">[[File:infil calculator results.png|thumb|center|350px|Groundwater recharge calculator results[https://infil1. | <div style="overflow: hidden">[[File:infil calculator results.png|thumb|center|350px|Groundwater recharge calculator results[https://infil1.srv.pathirana.net/ LINK]]] </div> | ||
[https://infil1. | [https://infil1.srv.pathirana.net/ LINK] | ||
===[http://fg. | ===[http://fg.srv.pathirana.net/ Flood Hazard and Risk Simulator]=== | ||
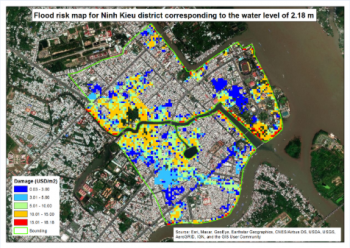
<div style="overflow: hidden">[[File:flood calculator results.png|thumb|center|350px|Flood Hazard and Risk Simulator Results. [https://infil1. | <div style="overflow: hidden">[[File:flood calculator results.png|thumb|center|350px|Flood Hazard and Risk Simulator Results. [https://infil1.srv.pathirana.net/ LINK]]] </div> | ||
[http://fg. | [http://fg.srv.pathirana.net// LINK] | ||
Revision as of 08:46, 9 April 2021
Webapps with python
For a long time, the tradition of providing technical solutions was the experts to do the designs and implement the designs for the benefit of the society. At a later stage, we started practising ‘awareness raising’. While this was a step in the right direction, by attempting to describe the why’s what’s and how’s of a technical solution to the societal stakeholders, awareness-raising often worked as an afterthought. A large body of evidence has shown that the best outcomes can be achieved by involving the community from day one of a technical solution. This day one is the planning and design stage. Whether it is money management in a family, a piece of policy in a government or an institution or any type of technical solution, best stakeholder support is obtained when people co-own the product. The journey to co-ownership starts with co-discovery (of knowledge), co-design and implementing together.
This applies to any type of technical solution. However, it becomes a non-negotiable requirement for success in climate and nature-based solutions. By their very nature, both the problem and its solutions are distributed in nature. Delivery of electricity from a customer from a thermal power plant also involves dealing with the ‘users’ – we call this customer management. But when we go for household level, grid-connected, solar electricity generation, that customer must become a business partner! That is the transformation we are witnessing in many sectors addressing problems with climate and nature-based solutions. This is how people are empowered to do designs. The pandemic is a portal, to make the wrongs right, and to build back better and greener.
One of the surefire ways of creating co-ownership is to encourage co-discovery and co-design. For this, we face the challenge of bringing modern technological knowledge to the stakeholders, including communities, in an understandable way but yet allowing for them to interact and contribute in a meaningful sense. One of the modern tools that contribute to this mission is interactive web applications. They allow water managers and scientists to bring complex data analysis solutions, big-data technologies, dynamic water models closer to the non-specialist stakeholders in an appealing and simple-to-interact fashion.
Demonstrations
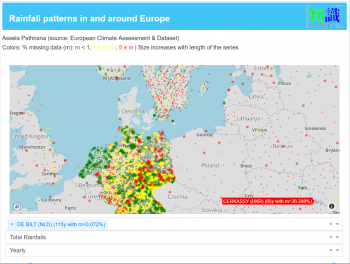
Here are some prototype web applications that were created for the water management, agriculture and asset management sectors. They are written in python using libraries like Plotly dash and web2py to do the frontend. I use docker containers based on dokku -- a PaaS (Platform as a Service) --to host these apps.
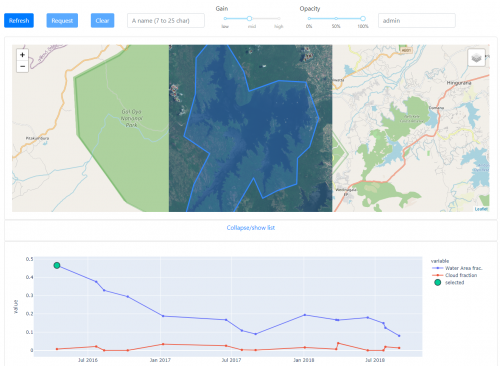
Seasonal levels in waterbodies using Sentinel-2 data
End-to-end automated system for calculating seasonal water availability in practically any waterbody.
