Difference between revisions of "Webapps with python"
| Line 12: | Line 12: | ||
===[http://lcc.wa.pathirana.net/ Life-cycle Costing Tool]=== | ===[http://lcc.wa.pathirana.net/ Life-cycle Costing Tool]=== | ||
[[File:life_cycle_costing_tool_python.png|thumb|450px|Life-cycle cost calculator. [https://lcc.wa.pathirana.net/ LINK]]] | [[File:life_cycle_costing_tool_python.png|thumb|450px|Life-cycle cost calculator. [https://lcc.wa.pathirana.net/ LINK]]] | ||
One of the routine tasks of Infrastructure Asset Management is to calculate the 'total cost of ownership' of an asset, for example, a building, a bridge or barrage. This involves consideration of the cost of purchase or construction, annual operation and maintenance, periodic renewal and sometimes the ultimate cost of disposal. These costs are all brought to the [https://en.wikipedia.org/wiki/Net_present_value present value (PV)] and aggregated. | |||
This app provides a convenient way to play with different cost components and interest rates (that is needed to calculate PV) and understand how that affects the whole life cost. | |||
===[http://oro.wa.pathirana.net Orographic lift of wind fields - atmospheric quantities calculator]=== | ===[http://oro.wa.pathirana.net Orographic lift of wind fields - atmospheric quantities calculator]=== | ||
Revision as of 14:10, 1 September 2019
Webapps with python
Python has a number of libraries that makes creating graphics based on data. Some of these tools can create interactive graphics and also web applications so that one can allow non-programmers to explore, analyse and visualize data. Ploty Dash is such a library with a particularly easy learning curve.
Here are some prototype applications that were created using this library. I use docker containers based on dokku -- a PaaS (Platform as a Service) --to host these apps.
Precipitation records of Europe
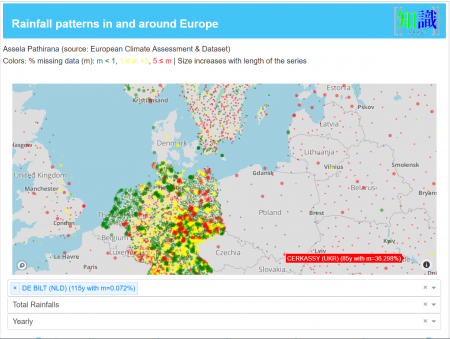
European Climate Assessment & Dataset project managed by Royal Netherlands Meteorological Institute (KNMI), collects meteorological data (pressure, humidity, wind speed, cloud cover and precipitation - see here for the complete description) from thousands of observation stations from (at the time of writing) 63 countries. As of september 2019, this database includes observations from 57312 stations.
We extracted the precipitation data from this dataset and provide it with a web application where the user can explore, do some simple trend analyses and download, downsampled data (Annual and monthly).
Life-cycle Costing Tool

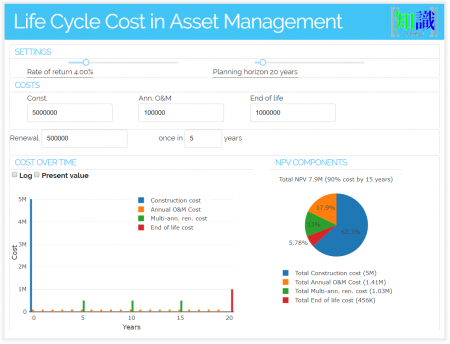
One of the routine tasks of Infrastructure Asset Management is to calculate the 'total cost of ownership' of an asset, for example, a building, a bridge or barrage. This involves consideration of the cost of purchase or construction, annual operation and maintenance, periodic renewal and sometimes the ultimate cost of disposal. These costs are all brought to the present value (PV) and aggregated.
This app provides a convenient way to play with different cost components and interest rates (that is needed to calculate PV) and understand how that affects the whole life cost.
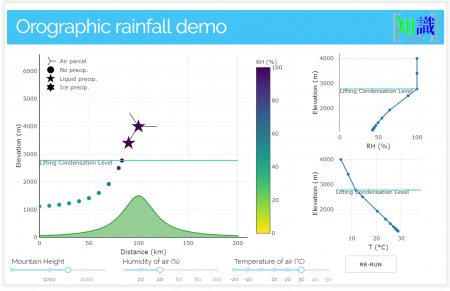
Orographic lift of wind fields - atmospheric quantities calculator

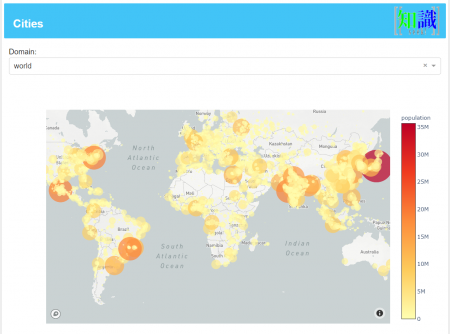
Urban population of the world

