Python has a number of libraries that makes creating graphics based on data. Some of these tools can create interactive graphics and also web applications so that one can allow non-programmers to explore, analyse and visualize data. Ploty Dash is such a library with a particularly easy learning curve.
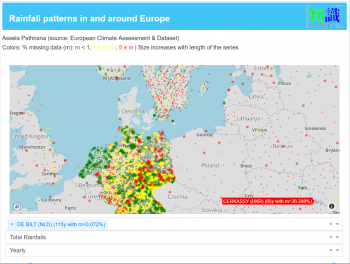
Interactive map, analysis and plotting tool for precipitation.
LINKEuropean Climate Assessment & Dataset project managed by Royal Netherlands Meteorological Institute (KNMI), collects meteorological data (pressure, humidity, wind speed, cloud cover and precipitation - see here for the complete description) from thousands of observation stations from (at the time of writing) 63 countries. As of September 2019, this database includes observations from 57312 stations.
We extracted the precipitation data from this dataset and provide it with a web application where the user can explore, do some simple trend analyses and download, downsampled data (Annual and monthly).
LINK
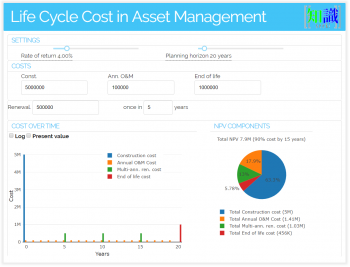
Life-cycle cost calculator.
LINKOne of the routine tasks of Infrastructure Asset Management is to calculate the 'total cost of ownership' of an asset, for example, a building, a bridge or barrage. This involves consideration of the cost of purchase or construction, annual operation and maintenance, periodic renewal and sometimes the ultimate cost of disposal. These costs are all brought to the present value (PV) and aggregated.
This app provides a convenient way to play with different cost components and interest rates (that is needed to calculate PV) and understand how that affects the whole life cost.
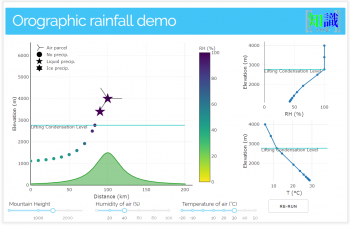
Atmospheric quantities with orographic uplift
LINKThis is an educational tool to demonstrate the interaction of wind fields with mountains. The user can change the mountain height, humidity and temperature of the air and observe how they contribute to the formation of precipitation (liquid or sometimes ice/snow).
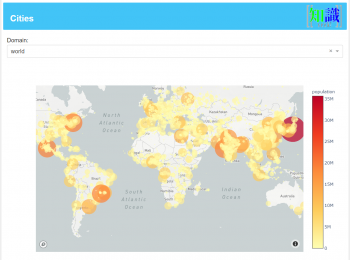
Urban population of the world. Selected 13000 urban centres from around the world.
LINKUsing the curated dataset provided by simplemaps website, this plot shows the urban population of the world. Note: This dataset does not cover all the populated places. It covers almost all major cities and towns, but the coverage of smaller places could be uneven.
In deep learning, a convolutional neural network (CNN) is a class of deep neural networks, most commonly applied to analyzing visual imagery.[1]
In this simnple demo example, I have trained a CNN with 40000 concrete images provided by [1].
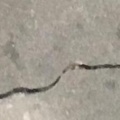
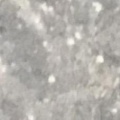
To test this app, first find some images of concrete with and without cracks. For example:

Crack detection in concrete with tensorflow
LINK
If you don't have such images, just search the web and download a few. Then go to the app and upload them. (You can drag and drop them onto the app as well.
Increasing built-up area causes runoff to increase. Sustainable drainage systems (SUDS) like rain-gardens, vegetated swales, urban wetland in-turn reduces runoff by mimicking the pre-urbanized natual conditions. This application is a proof of concept of running a dynamic urban drainage model (EPA SWMM 5.0) in the backend to explore
(a) Response (runoff) under pristine conditions
(b) under built-up conditions (of a given percentage)
(c) built-up conditions together with some SUDS interventions.
for various urban catchments.
This application has an administrative interface that can be used to add more examples. Obviously that interface is password protected and not open to the public.
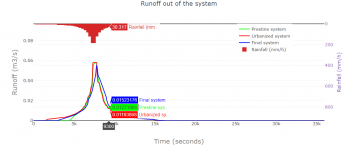
SWMM model results under different catchment conditions
LINKThe user provides several input parameters: roof area over which the rainwater is collected, the size of tank planned and the demand – how much water is planned to be used for how many months (e.g. during dry period). Based on user’s location the tool will automatically select historical rainfall data from the nearest meteorological station. Then it simulates the harvesting and usage performance for several decades. Such calculations involving multiple years (for the Maldives this can be about 20-30 years in most cases) gives much better indication of the working of a rainwater harvesting system than just assessing it against one or two years of data. Like many other climates of the world the climate of the Maldives also shows great deal of ‘inter-annual’ variability. Simulations involving a longer period therefore gives a more realistic picture of the performance of the system in the backdrop of such variability.
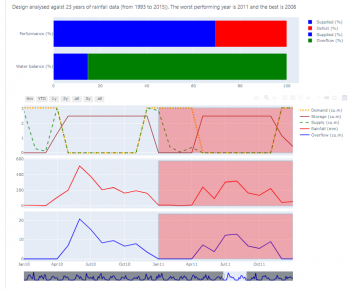
Rainwater harvesting calculator results.
LINKLINK
The tool allows the user to choose this by providing the hourly rainfall rate and number of hours over which that intensity will continue. After providing the size of the infiltration pit, whether it is filled with gravel or just empty and the surrounding soil type, the user can calculate the performance of the system. The results are provided as a graphic as well as graph of water level in the structure and any overflow.
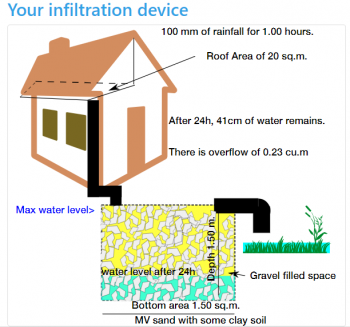
Groundwater recharge calculator results
LINKLINK
- ↑ Lei Zhang , Fan Yang , Yimin Daniel Zhang, and Y. J. Z., Zhang, L., Yang, F., Zhang, Y. D., & Zhu, Y. J. (2016). Road Crack Detection Using Deep Convolutional Neural Network. In 2016 IEEE International Conference on Image Processing (ICIP). http://doi.org/10.1109/ICIP.2016.7533052


