Difference between revisions of "Webapps with python"
| Line 9: | Line 9: | ||
==Demonstrations== | ==Demonstrations== | ||
Here are some prototype web applications that were created for the water management, agriculture and asset management sectors. They are written in python using libraries like [https://plotly.com/dash/ Plotly dash] and [http://www.web2py.com/ web2py] to do the frontend. I use [https://auth0.com/blog/hosting-applications-using-digitalocean-and-dokku/ docker containers] based on [http://dokku.viewdocs.io/dokku/ dokku] -- [https://en.wikipedia.org/wiki/Platform_as_a_service a PaaS (Platform as a Service)] --to host these apps. | Here are some prototype web applications that were created for the water management, agriculture and asset management sectors. They are written in python using libraries like [https://plotly.com/dash/ Plotly dash] and [http://www.web2py.com/ web2py] to do the frontend. I use [https://auth0.com/blog/hosting-applications-using-digitalocean-and-dokku/ docker containers] based on [http://dokku.viewdocs.io/dokku/ dokku] -- [https://en.wikipedia.org/wiki/Platform_as_a_service a PaaS (Platform as a Service)] --to host these apps. | ||
===[Seasonal levels in waterbodies using Sentinel-2 data https://waterdetect.srv.pathirana.net/] | |||
End-to-end automated system for calculating seasonal water availability in practically any waterbody. | |||
Background | |||
Sentinel-2 s an Earth observation mission from the Copernicus that systematically acquires multispectral, optical imagery at high spatial resolution (10 m to 60 m) over land and coastal waters. | |||
Sentinelhub (a partner of Euro Data Cube consortium), operated by a private IT company, provides cloud services for sentinel-2 data. This provides an excellent way to access (petabytes of) data using a Python-based API. Eo-learn is a collection of open-source Python packages that have been developed to access and process Spatio-temporal satellite image sequences. | |||
This web application shows how these technologies can be integrated to provide cloud-based data services in a manner that can be used by non-experts. | |||
===What it does=== | |||
It uses [https://sentinel.esa.int/web/sentinel/missions/sentinel-2 Sentinal-2] images (specifically RGB and near-infrared bands - or B02, B03, B04 and B08) to identify water. It goes through a series of images (taken at different times) of the location of interest and calculate the fraction of area covered by water. This provides an easy way to estimate the water amount in reservoirs, lakes and other water bodies. (Note: However, what this application calculates is the fraction (Area covered with water)/(a nominal area). So to really convert it to water volumes, we need the land contours of the reservoir.) | |||
===How it works=== | |||
User provides a water body by marking it with a polygon by clicking on the map. Gives the location a name and submit it for processing by pressing the 'Request' button. | |||
An automated processing engine is waiting in the background. (However, see the limitation below for a caveat!). Once the user submits the request, it will queue it with many other requests (made by multiple users) and process them. This is a numerically expensive (and costing a lot of network bandwidth) task for the server. | |||
The user visits the site later (and press 'Refresh' button) to check if the submitted job is finished. If it is it will appear in the table below. | |||
The user can select a result set by clicking on a tick-box on the left. Then the time-series of the water area fraction will appear at the bottom graph. | |||
Click on the graph points to see the satellite images overlayed on the map. (use Gain and Opacity to finetune how it looks). | |||
===Current limitations=== | |||
While the web-application system can do this whole process automatically and upscale really well (responding many user requests at the same time for example), it cost processing power, network bandwidth and sentinel-hub processing units (which have to be paid). Currently my server (which runs more than 15 web applications) has only 8GB of RAM. For the backend to work well it needs about 32GB. Network bandwidth is not a problem. However, sentinel hub processing units are. Currently I am using their 'trial' account to demonstrate this. However, for the system to scale-up a paid account is needed. | |||
So at the moment, I am running this system in a limited mode. | |||
User submitted jobs do not directly go to the processing engine. Instead, an admin (currently me) have to 'approve' them. (I can do this by clicking on the same table after authenticating). Then it will automatically be processed by the backend system. Why: My account at the sentinel hub has very limited resources. | |||
While the system processes all satellite images available covering a period, only the first 10 are saved as images. (Try clicking on points on the time-series graph, only the first 10 will show the corresponding image on the map.) | |||
Currently I am using a simple water detection method (Otsu threshold method). | |||
Due to the limited resources of the server the system is not very responsive at the moment. The client application needs optimising too. | |||
===What you can do (currently)=== | |||
Feel free to experiment with the job submission system. | |||
Examine already processed result sets. | |||
===Technologies used=== | |||
The frontend (what you see) is implemented on Flask and Plotly-dash systems. Maps are provided by OpenStreetMap with Leaflet interactive map library. Plotly was used to draw the graphs. The system runs on a Linux Virtual Private Server with two vCores and 8GB of RAM. The processing engine (the system that talks with the sentinel hub and processes satellite data, does the calculations and convert the results to something that can be understood by the front end) is implemented as a systemd service. | |||
The administration system is secured with two-factor authentication, along with a time-based OTP (onetime password) system. | |||
===Next step?=== | |||
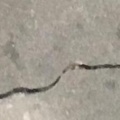
These type of end-to-end automated data processing systems provide great opportunities to apply machine learning techniques like the convolutional neural networks to generate higher-level knowledge based on what we calculate. For example, I have used Tensorflow to demonstrate how to detect cracks in concrete by automatic image identification. | |||
For example, the same can be used to do land use classification at a much better accuracy level and higher scalability. (See this, this and this But that's for later. | |||
(After reading, click on the cross (top right) to get this message out of the way.) | |||
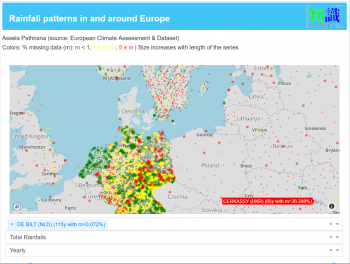
===[http://er.srv.pathirana.net/ Precipitation records of Europe]=== | ===[http://er.srv.pathirana.net/ Precipitation records of Europe]=== | ||
Revision as of 08:00, 9 April 2021
Webapps with python
For a long time, the tradition of providing technical solutions was the experts to do the designs and implement the designs for the benefit of the society. At a later stage, we started practising ‘awareness raising’. While this was a step in the right direction, by attempting to describe the why’s what’s and how’s of a technical solution to the societal stakeholders, awareness-raising often worked as an afterthought. A large body of evidence has shown that the best outcomes can be achieved by involving the community from day one of a technical solution. This day one is the planning and design stage. Whether it is money management in a family, a piece of policy in a government or an institution or any type of technical solution, best stakeholder support is obtained when people co-own the product. The journey to co-ownership starts with co-discovery (of knowledge), co-design and implementing together.
This applies to any type of technical solution. However, it becomes a non-negotiable requirement for success in climate and nature-based solutions. By their very nature, both the problem and its solutions are distributed in nature. Delivery of electricity from a customer from a thermal power plant also involves dealing with the ‘users’ – we call this customer management. But when we go for household level, grid-connected, solar electricity generation, that customer must become a business partner! That is the transformation we are witnessing in many sectors addressing problems with climate and nature-based solutions. This is how people are empowered to do designs. The pandemic is a portal, to make the wrongs right, and to build back better and greener.
One of the surefire ways of creating co-ownership is to encourage co-discovery and co-design. For this, we face the challenge of bringing modern technological knowledge to the stakeholders, including communities, in an understandable way but yet allowing for them to interact and contribute in a meaningful sense. One of the modern tools that contribute to this mission is interactive web applications. They allow water managers and scientists to bring complex data analysis solutions, big-data technologies, dynamic water models closer to the non-specialist stakeholders in an appealing and simple-to-interact fashion.
Demonstrations
Here are some prototype web applications that were created for the water management, agriculture and asset management sectors. They are written in python using libraries like Plotly dash and web2py to do the frontend. I use docker containers based on dokku -- a PaaS (Platform as a Service) --to host these apps.
===[Seasonal levels in waterbodies using Sentinel-2 data https://waterdetect.srv.pathirana.net/]
End-to-end automated system for calculating seasonal water availability in practically any waterbody.
Background Sentinel-2 s an Earth observation mission from the Copernicus that systematically acquires multispectral, optical imagery at high spatial resolution (10 m to 60 m) over land and coastal waters.
Sentinelhub (a partner of Euro Data Cube consortium), operated by a private IT company, provides cloud services for sentinel-2 data. This provides an excellent way to access (petabytes of) data using a Python-based API. Eo-learn is a collection of open-source Python packages that have been developed to access and process Spatio-temporal satellite image sequences.
This web application shows how these technologies can be integrated to provide cloud-based data services in a manner that can be used by non-experts.
What it does
It uses Sentinal-2 images (specifically RGB and near-infrared bands - or B02, B03, B04 and B08) to identify water. It goes through a series of images (taken at different times) of the location of interest and calculate the fraction of area covered by water. This provides an easy way to estimate the water amount in reservoirs, lakes and other water bodies. (Note: However, what this application calculates is the fraction (Area covered with water)/(a nominal area). So to really convert it to water volumes, we need the land contours of the reservoir.)
How it works
User provides a water body by marking it with a polygon by clicking on the map. Gives the location a name and submit it for processing by pressing the 'Request' button. An automated processing engine is waiting in the background. (However, see the limitation below for a caveat!). Once the user submits the request, it will queue it with many other requests (made by multiple users) and process them. This is a numerically expensive (and costing a lot of network bandwidth) task for the server. The user visits the site later (and press 'Refresh' button) to check if the submitted job is finished. If it is it will appear in the table below. The user can select a result set by clicking on a tick-box on the left. Then the time-series of the water area fraction will appear at the bottom graph. Click on the graph points to see the satellite images overlayed on the map. (use Gain and Opacity to finetune how it looks).
Current limitations
While the web-application system can do this whole process automatically and upscale really well (responding many user requests at the same time for example), it cost processing power, network bandwidth and sentinel-hub processing units (which have to be paid). Currently my server (which runs more than 15 web applications) has only 8GB of RAM. For the backend to work well it needs about 32GB. Network bandwidth is not a problem. However, sentinel hub processing units are. Currently I am using their 'trial' account to demonstrate this. However, for the system to scale-up a paid account is needed.
So at the moment, I am running this system in a limited mode.
User submitted jobs do not directly go to the processing engine. Instead, an admin (currently me) have to 'approve' them. (I can do this by clicking on the same table after authenticating). Then it will automatically be processed by the backend system. Why: My account at the sentinel hub has very limited resources. While the system processes all satellite images available covering a period, only the first 10 are saved as images. (Try clicking on points on the time-series graph, only the first 10 will show the corresponding image on the map.) Currently I am using a simple water detection method (Otsu threshold method). Due to the limited resources of the server the system is not very responsive at the moment. The client application needs optimising too.
What you can do (currently)
Feel free to experiment with the job submission system. Examine already processed result sets.
Technologies used
The frontend (what you see) is implemented on Flask and Plotly-dash systems. Maps are provided by OpenStreetMap with Leaflet interactive map library. Plotly was used to draw the graphs. The system runs on a Linux Virtual Private Server with two vCores and 8GB of RAM. The processing engine (the system that talks with the sentinel hub and processes satellite data, does the calculations and convert the results to something that can be understood by the front end) is implemented as a systemd service. The administration system is secured with two-factor authentication, along with a time-based OTP (onetime password) system.
Next step?
These type of end-to-end automated data processing systems provide great opportunities to apply machine learning techniques like the convolutional neural networks to generate higher-level knowledge based on what we calculate. For example, I have used Tensorflow to demonstrate how to detect cracks in concrete by automatic image identification. For example, the same can be used to do land use classification at a much better accuracy level and higher scalability. (See this, this and this But that's for later.
(After reading, click on the cross (top right) to get this message out of the way.)
