Difference between revisions of "AtmosphericPlot"
| (15 intermediate revisions by the same user not shown) | |||
| Line 1: | Line 1: | ||
[[Image:DSC_0194.JPG|thumb]] | |||
==Reinventing the Wheel is Fun! But...== | ==Reinventing the Wheel is Fun! But...== | ||
There is a lot of resources on the [[wikipedia:Standard Atmosphere|Standard Atmosphere]] on the web in forms of tables, online calculators, etc. So, one does not really need to write yet another program to do those computations. However, there is this little known package in [[wikipedia:Mathematica]] software that helps the user to draw graphs (or do computations) of the variation of physical quantities in the atmosphere with height. Lovely! | There is a lot of resources on the [[wikipedia:Standard Atmosphere|Standard Atmosphere]] on the web in forms of tables, online calculators, etc. So, one does not really need to write yet another program to do those computations. However, there is this little known package in [[wikipedia:Mathematica|Mathematica]] software that helps the user to draw graphs (or do computations) of the variation of physical quantities in the atmosphere with height. Lovely! | ||
==The Notebook== | ==The Notebook== | ||
I have written the following Mathematica notebook based on Mathematica's AtmosphericPlot package, to use in my classes on [[Atmospheric Science and Modelling]] at [[Chuo University]]. Not | I have written the following Mathematica notebook based on Mathematica's AtmosphericPlot package, to use in my classes on [[Atmospheric Science and Modelling]] at [[Chuo University]]. Not exactly rocket science, but may be useful for somebody specially because there is not much documentation of the AtmosphericPlot package. | ||
Download the notebook from [[:Media:atmospheric-calculations.zip|atmospheric-calculations.nb]] (Tested with [[wikipedia:Mathematica|Mathematica]] version 5.2.) | |||
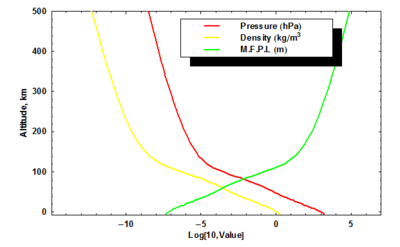
[[Image:pres-density-mfpl-mathemati.png|400px|left|thumb|Vertical variation of Pressure, Density and Mean-free-path-length.]] | |||
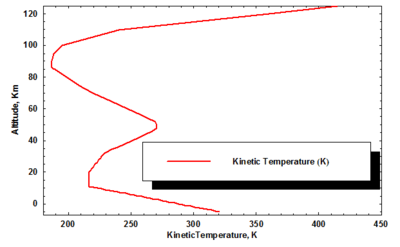
[[Image:temperature-mathamati.png|400px|right|thumb|Vertical variation of Kinetic Temperature.]] | |||
[[Category:Mathematica]][[Category:Hydrology-Meteorology]] | |||
Latest revision as of 02:55, 12 June 2006
Reinventing the Wheel is Fun! But...
There is a lot of resources on the Standard Atmosphere on the web in forms of tables, online calculators, etc. So, one does not really need to write yet another program to do those computations. However, there is this little known package in Mathematica software that helps the user to draw graphs (or do computations) of the variation of physical quantities in the atmosphere with height. Lovely!
The Notebook
I have written the following Mathematica notebook based on Mathematica's AtmosphericPlot package, to use in my classes on Atmospheric Science and Modelling at Chuo University. Not exactly rocket science, but may be useful for somebody specially because there is not much documentation of the AtmosphericPlot package.
Download the notebook from atmospheric-calculations.nb (Tested with Mathematica version 5.2.)


