A Productive Desktop Environment for Scientists and Engineers - Part II
Completed Chapters
GIS ? ... Not quite!
Recently many have fallen into the the habit of throwing around the term Geographical Information System (or much cooler GIS) as if it is something we eat for our lunch everyday! While these are extremely useful tools for many advanced applications in different fields, often one does not need a full-fledged GIS system to achieve many targets related to processing of spatial data.
Personally I found that more than 50% of the tasks I had to do with spatial datasets could be realized using tools far less complicated than a complete GIS system. There are a number of software products that can be used to draw beautiful maps and also to perform some basic spatial data analysis tasks. We shall learn to use one of them in this chapter.
- Note
- It is important that we have a basic knowledge on the tools like cygwin, Unix commands, shell scripting, awk, sed, etc. Therefore it is necessary to complete the previous section, before attempting this one.
GMT - The Generic Mapping Tools
GMT is an open source collection of ~60 tools for manipulating geographic and Cartesian data sets (including filtering, trend fitting, gridding, projecting, etc.) and producing Encapsulated PostScript File (EPS) illustrations ranging from simple x-y plots via contour maps to artificially illuminated surfaces and 3-D perspective views. GMT supports ~30 map projections and transformations and comes with support data such as coastlines, rivers, and political boundaries.
One of the strong points of the GMT tools is that it has an excellent set of documents, which includes a tutorial, comprehensive manual pages on each command and a cook-book of real-world examples (GMT Documentation). Further, there is a very active GMT mailing list. This should be the forum to ask questions that are beyond the basic set of documents.
The biggest weak point of GMT is that each of its 60 odd commands have extensive list of arguments, that are hard to remember and even harder to use accurately. But, then this is a problem of any advanced computer tool -- there are no simple solutions for complex problems!
In this pages, we shall first explore a simple example or two using the hard way; then learn how to lessen the pain of scripting by taking some shortcuts. Finally we will go through some fairely complicated examples.
Installation
There are numerous ways of arriving at the target of a usable GMT installation. Even, GMT can work on Windows. However, my advice is to use it on a Unix environment. Since we already have a functional Cygwin environment, that's where we start.
There is a page on the GMT site, that explains in detail, the installation procedure. However, for the first time user it can be a bit complicated (particularly due it's very general nature). Let's go step by step.
#in cygwin
mkdir /usr/local/GMT #create a directory for installation
cd /usr/local/GMT
# Download the installation script.
wget ftp://ftp.soest.hawaii.edu/gmt/install_gmt
- Go to GMT install form.
- Change only the following values:
- Select archive format: bzip2
- Select default PostScript output format for GMT: Encapsulated PostScript (EPS)
- Select the appropriate netCDF library option: Please get and install netCDF 3.6 (Give full pathname to the netCDF directory: /usr/local/netCDF)
- Select the components you want (gzip/bzip2 sizes indicated): <Click all>
- Select the C compiler you want to use: gcc
- Select supplemental packages to install: unselect MEX
- Submit the form and save the resulting form as GMTparam.txt at c:
- Change only the following values:
cygwin\usr\local\GMT using the Save As menu of the web browser.
#in cygwin
cd /usr/local/GMT
bash install_gmt GMTparam.txt
- The installation will take a fair amount of time depending on your computer hardware and level of network connectivity. If everything has gone smoothly the sript will exit with a message like the following. (some lines removed.)
GMT installation complete. Remember to set these:
-----------------------------------------------------------------------
..
..
For sh or bash users:
export NETCDFHOME=/usr/local/netCDF
export GMTHOME=/usr/local/GMT/GMT4.1.1
export PATH=/usr/local/GMT/GMT4.1.1/bin:$PATH
For all users:
Add /usr/local/GMT/GMT4.1.1/man to MANPATH
Add /usr/local/GMT/GMT4.1.1/www/gmt/gmt_services.html as browser bookmark
-----------------------------------------------------------------------
- Now add the required environment variables to /etc/bashrc file using a text editor:
# GMT environment settings
export NETCDFHOME=/usr/local/netCDF
export GMTHOME=/usr/local/GMT/GMT4.1.1
export PATH=/usr/local/GMT/GMT4.1.1/bin:$PATH
export MANPATH=$MANPATH:/usr/local/GMT/GMT4.1.1/man
# GMT environment settings end.
EOF
- Finally, close cygwin windows, open one again.. and you are done.
Additional programs
To fully enjoy the GMT, we need the following two free utilities.
- ghostscript & gv
- Imagemagick
All these are available as standard packages of cygwin. (i.e. can be installed automatically using cygwin setup.exe.) They are listed under Graphics category. Install these before proceeding to the next section. One can test
Test your installation
Ghostscript, gv and Imagemagick
- First test gv.
- Try viewing any postscript file with gv command. (You can download one from here. Don't forget to expand it before trying the following!)
bunzip2 Sample-postscript.ps.bz2
gv sample-postscript.ps &
If everything is shipshape with ghostscript and gsview, you should see a window with a graphic image. See this page for further details on this program.
- Then, Imagemagick
/bin/convert Sample-postscript.ps sample.png
If there are no complains, try viewing the resulting png file, sample.png by opening it with your web browser. If the image looks fine, then we are done with Imagemagick! Have a look at the imagemagick documentation.
GMT Tools
In fact, the GMT tools have been already tested by the installer. There are a number of examples that come with GMT and the installer run each of them (unless we opt not to in the install form). The folder /usr/local/GMT/GMT4.1.1/examples should have a number of sub folders named ex01, ex02 and so on and each of them should have a postscript file named example_0n.ps. View them using gv.
A flavour of GMT
Now, lets try some simple GMT commands ourselves. One of the most simple commands is minmax:
- First let's create a simple text file with several numerical values (this example has three columns wih four values in each):
$ cat << SOMEFLAG > test.txt
-2 3 5
-8 -1 5.5
0 2 6
1 1 1
SOMEFLAG
- now try minmax on the data file
$ minmax test.txt
which will give the result:
test.txt: N = 4 <-8/1> <-1/3> <1/6>
The meaning of this result should be obvious. It says, there are four rows of values, and prints the min/max value pairs for each column.
Hello, World! -- GMT sytle
Always make it a habit to consult the GMT manual pages when you want to use a command. (They are automatically installed in your computer when you install GMT.)
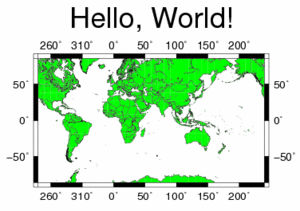
Let's keep up the tradition and start with writing the famous 'Hello, World!' program in GMT. But, we'll do that in style!
$ pscoast -JM10c -R-120/240/-70/70 -B50:."Hello, World!": -G0/255/0 -N1 -W > world.ps
Have a look at the resulting PostScript file with gv:
$ gv world.ps
Similar to the previous tools that we discussed in these pages, here also, we don't attempt to cover the basics of GMT here. Our purpose is to get the flavour of the tool, after having a comfortable computing environment to try it out. After that, we may look at the GMT Cookbook, GMT man pages and the GMT tutorial.
Before going to a bit more complex example, let's go through the GMT command we have used to create this image.
- The purpose of pscoast command is obvious, it draws coastlines. But, it can draw, political boundaries (as we did), major and minor rivers and many other linear features.
- -JM10c says to draw a map of width 10cm, in Mercator(M) projection.
- -R indicates the limits of the map.
- -B specifies the frame styles, annotations, titles etc.
- -G, -W, -N1, for what to draw in the map and what colors to use.
- finaly, we write the output to the Postscript file named world.ps.
A much involved example
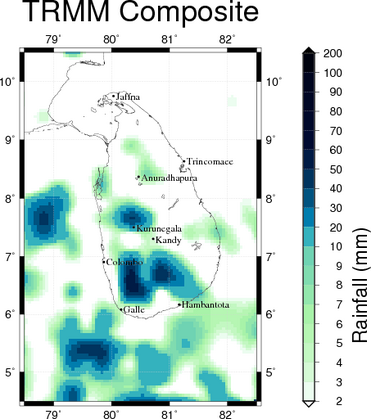
One of the strengths of the GMT tools is the ability of superimposing a number of geological datasets to produce an informative map. We'll domonstrate this feature by plotting a map of island of Sri Lanka with a bit of the surrounding ocean and overlaying the map with a GFAS rainfall map (similar to the one we have used in a previous chapter).
When we overlay several maps, we have to use the special options -O and -K
- -O says 'we are writing on to a map previously started by other command(s).'
- -K says 'we will write more to this map in later command(s).'
Rather than doing our task in a single script, let's complete it in several steps for better understanding.
- Get the data and transform it to a GMT format. For 2-D data, GMT has an efficient binary format known as 'grd format'. A sample dataset is here. Uncompress (bunzip2) it to create rain1day_02_20060421. Alternatively you can download a more recent dataset from GFAS trial site.
dos2unix rain1day_02_20060421 #just to make sure!
cat rain1day_02_20060421|sed 's/,[ ]\+/\n/g'|\
xyz2grd  -Z  -R30/90/-60/60 -I0.25/0.25 -F -Gss.grd
- -Z : indicates we are processing a file with only z values (not x,y,z triplets)
- -I : The grid spacing in x and y (longitude and latitude) directions.
- -F : our data is in pixel registration, rather than default, grid line registration.
- grdinfo command will produced some information on the grd:
$ grdinfo ss.grd
ss.grd: Title: z
ss.grd: Command: xyz2grd -Z -R30/90/-60/60 -I0.25/0.25 -F\
 -Gss.grd
ss.grd: Remark:
ss.grd: Pixel node registration used
ss.grd: grdfile format: nf (# 18)
ss.grd: x_min: 30 x_max: 90 x_inc: 0.25 name: xyz2grd \
-Z -G nx: 240
ss.grd: y_min: -60 y_max: 60 y_inc: 0.25 name: yyz2grd \
-Z -G ny: 480
ss.grd: z_min: 0 z_max: 214.08 name: zyz2grd -Z -G
ss.grd: scale_factor: 1 add_offset: 0
- We shall mark some key cities of the island. For that we need to prepare a file with coordinates and names of cities (call it sl-cities.txt) :
80.4667 8.36667 Anuradhapura
79.867 6.9 Colombo
80.1667 6.08333 Galle
81.1667 6.16667 Hambantota
80.0333 9.75 Jaffna
80.7167 7.3 Kandy
80.3833 7.5 Kurunegala
81.25 8.63333 Trincomaee
(Take care not to leave any empty lines in this file.)
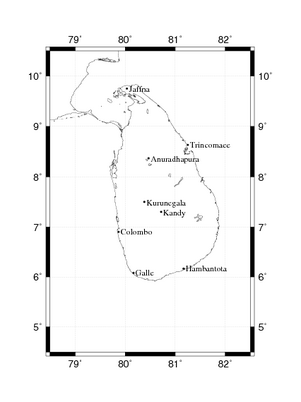
- Let's look at how to draw the map and mark the cities first (not bothering about rainfall data at this stage:
#!/bin/bash
gmtset GRID_PEN 1/200/200/200ta
pscoast -R78.5/82.5/4.5/10.5 -JM10c -W -Df  -P  -K -B1g1 > map.ps
cat sl-cities.txt|awk '{print $1,$2}'|psxy -G0/0/0 -Sc0.1c -R -J -P  -O -K >> map.ps
cat sl-cities.txt|awk '{print $1,$2,"12 0 4 LM "$3}'|pstext -D.1c -R -J -P  -O >> map.ps
- pscoast draws the map.
- psxy marks the points (small black dots on the map) for cities
- pstext writes the name of the city beside the location.
- Now we'll write the whole script in one shot (We shall save it as gfas-plot.bash):
gfas-plot.bash
#!/bin/bash
#program gfas-plot.bash
cat  rain1day_02_20060421 |sed 's/, \+/\n/g' |\
   xyz2grd -Z  -R30/90/-60/60 -I0.25/0.25 -F -Gss.grd
gmtset GRID_PEN 1/200/200/200ta
makecpt -Cocean -I -Qo -T2/200/3 > rain.cpt
grdsample ss.grd -Gss2.grd -I.05/0.05 -R
grdimage ss2.grd   -R78.5/82.5/4.5/10.5 \
  -JM10c -B1g1:."TRMM Composite": -Crain.cpt -P -K > ss.ps
pscoast -R -J -W -Df  -P -O -K >> ss.ps
cat sl-cities.txt|awk '{print $1,$2}'|\
psxy -G0/0/0 -Sc0.1c -R -J -P  -O -K >> ss.ps
cat sl-cities.txt|awk '{print $1,$2,"12 0 4 LM "$3}'|\
pstext -D.1c -R -J -P  -O -K >> ss.ps
psscale -Crain.cpt -D12c/7.5c/15c/.5c -O -E \
    -L -B:"Rainfall (mm)":>> ss.ps
- makecpt creates a color map file to represent various values.
- grdsample is optional here. It creates a higher resolution (0.1deg) grid from our original grid. This helps to produce a much smoother plot.
- psscale draws a scale bar.
- Note the order of commands. We draw the map only after plotting the image (rainfall). Otherwise, rainfall image will cover the map.
Doing simple things simple way
Some people ask what is the purpose of writing five lines of code when you can spend an hour with a GUI based map making software to do the same thing. Well.. there are several reasons, some that comes to my mind now are:
- Writing a script is an incredibly cool, super geeky thing to do! :-)
- One don't have to 'remember' the steps when the steps are in fact written in a single step. Only remember the script name and where you have it.
- It is rather easy to produce 9841 maps with different datasets without breaking your wrist!
- It is very easy to automate for many situations (e.g. Image posting for web applications). For example, it may be a bit hard to put up something like this with a GUI based tool.
Now there are times we need to draw a no-nonsense, quick and dirty map within seconds. Then a GUI based application helps. Well.., the good news is, GMT can be used as one!
iGMT -- a GUI for GMT
iGMT is a tool written by Thorsten Becker and Alexander Braun to make it easy to produce basic GMT stuff without writing code by hand. More than that I found that this is an excellent tool to avoid reading the manual pages! The trick is, you use iGMT to produce a basic script by pushing buttons, then manually edit the code to do exactly what you want.
Installing iGMT on Cygwin
This section was written on 2006-05-01. It is quite possible that this section becomes rapidly outdated. Always check around in the web, if in doubt.
Additoinally needed Software
If you have followed the instructions in previous pages to get a working cygwin environment, installed tools like ghostscript, GMT, etc., then the only piece of software needed is a Tcl/Tk (don't worry about the name) installation for Cygwin. But, there is a catch here. Due to some internal requirement, the package of Tcl/Tk that comes with Cygwin (and chances are high that it is already installed in your system by now,) is not Cygwin X11 type one, but a native windows application. The problem with this is, this original Tcl/Tk does not understand stuff like /usr/local or /home/alibabba/ but works with stuff like c:\Documents and Settings\alibabba ! That's bad news for us. We need to have a 'native' X11 Tcl/Tk package for iGMT to work and it is not an easy task. Lucky for us, Tim Edwards has done the hard part for us and has greciously allowed the world to download a ready-to-run X11 Tcl/Tk package from here.
Download it and expand it at /usr/local:
cd /
wget http://opencircuitdesign.com/cygwin/archive/tcltk_x11_win.tgz
tar -xzf tcltk_x11_win.tgz
#Done! now test
export PATH=$PATH:/usr/local/lib
/usr/local/wish &
#Above should create an empty window with an X (like in your X-term window) on the top left.
iGMT
Now, download iGMT, expand it and install following the instructions in the documentation (available form iGMT site). Then add the following to the /etc/bashrc file. Start a new xterm.
#iGMT
export igmt_root=/usr/local/GMT/iGMT/igmt_1.2
#needs an tcl/tk with x support
export PATH=$PATH:/usr/local/lib
export wish_cmd=/usr/local/bin/wish.exe
alias igmt=/usr/local/GMT/iGMT/igmt_1.2/igmt
#iGMT end
The command igmt & should now start the program.
Data
Download several datasets from the iGMT site. Especially GTOPO 30 data (this is not the original USGS one! This has ocean floor data.)
Running igmt
iGMT has a very intututive user interface, that makes details instructions quite unnecessary. Further, there is a User Manual that explains the task of each menu command. However, there are some tips that may be useful:
- Don't attempt to get the perfect map, tinkering with buttons. Just get a rough cut, save the script and then start editing the script directly to get exact layout.
- If you need 50 maps with different datasets, obviously there is no point of doing all of them one by one in the GUI. Just write a loop to run the script with proper parameters. What we have learned in previous chapters on bash shell scripting should be adequate.
- Use a vector editor like Adobe Illustrator or Inkscape to further spruce up your images by editing the Poscript file that is produced by iGMT scripts.
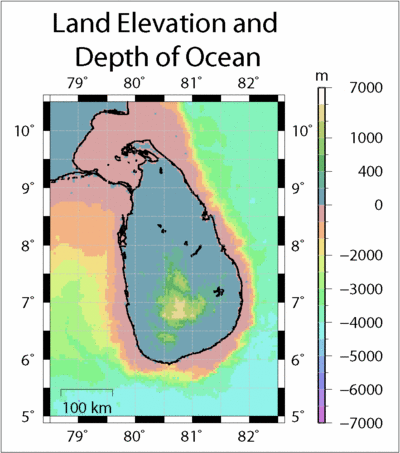
Following is a script created by iGMT
#!/bin/bash
###############################################
#
# script produced with iGMT, version 1.2
#
# All commands are in bash resp. ksh syntax:
# "#" leads a comment line,
# "\" means line continuation
# and variables are declared as "a=1" and
# referenced as "echo $a"
#
#################################################
# The following variables are used for all
# the GMT commands.
# Modify the settings here, further down all
# references in the script
# such as "$region" are replaced by the shell.

# Location of the GMT binaries:
gmtbin=/usr/local/GMT/GMT4.1.1/bin/

#	save old gmtdefaults paper size setting and use EPS
old_psize=`$gmtbin/gmtdefaults -L | grep PAPER_MEDIA | gawk '{print($3)}'`
$gmtbin/gmtset PAPER_MEDIA letter+

# Geographical variables:

# Set the projection, typically the last number is the mapwidth
projection=-JM80.500000/0.000000/6.800000in

# Set the plotting region (west/east/south/north boundaries)
region=-R78.5/82.5/5/10.5

# Set the data region (might be different from  plotting region)
data_region=-R78/83/5/11

# Set the raster data resolution
raster_inc=-I60m

# Postscript output:

# Set the name of the output (postscript) file
ps_filename=/tmp/igmt_alibabba.ps

# Set the X and Y offset on the postscript plot (in inches)
offsets='-X1.0in -Y1.0in'

# set this to -P for portrait mode, else landscape
portrait=-P

# set this to -V for verbose GMT output, else leave blank for quite mode
verbose=-V

# raster data set specific:

# main directory for raster (grd) data:

rasterpath=/usr/local/GMT/iGMT/wrk/data

# Set the name of the colormap used for imaging a grid file
colormap=/usr/local/GMT/iGMT/igmt_1.2/colormaps/topo.cpt

# Set the name of the temporary grd file output
temp_grid_filename=/tmp/igmt_alibabba.grd

################################################################################
#
# GMT plotting commands follow
#
################################################################################
# Plotting GTOPO30 topography
# Create a temporary grid file using the img2grd script
$gmtbin/img2grd $rasterpath/gtopo30/topo_8.2.img \
	 $data_region -T1 -G$temp_grid_filename -S1
# Use grdimage to create a raster map.
$gmtbin/grdimage $temp_grid_filename $region $projection \
	-C$colormap  \
	$verbose  $portrait  $offsets -K > $ps_filename

# Add a scale beneath the plot.
$gmtbin/psscale -C$colormap \
	-D8/4.8/10/0.2 -B/:"m": \
	 -L  $verbose -O -K  >> $ps_filename

# Use pscoast for possible features such as national boundaries.
$gmtbin/pscoast  -W1p/000/000/000  $region $projection -Df  -I1/1p/000/000/255 $portrait   \
	 -O -K  $verbose >> $ps_filename

# Use psbasemap for basic map layout, possible title
#     and complete the plot
#     map-scale is correct at mid latitude
$gmtbin/psbasemap  $region $verbose $projection \
	  -Ba00001f0.500g0.500/a00001f0.500g0.500:."Elevation":WESN \
	 -Lx1.1/0.8/7.75/100 -O   >> $ps_filename

# comment out (remove the #) the line after next to delete temporary files after script execution
# remove temporary files
#rm -f  $temp_grid_filename $temp_shade_filename 2> /dev/null
$gmtbin/gmtset PAPER_MEDIA $old_psize
Animations with GMT Tools
Once I saw one of young colleagues busy with cutting and pasting stuff on Microsoft powerpoint and I asked what he is doing. He replied that he is making an animation for a presentation. He needed about 100 graphs each of the same size and then to make them into a movie. What he was doing was drawing each graph in Excel, then cutting and pasting it to a new slide in Powerpoint. Then he exported the powerpoint file to a series of images, then used another software to convert that series of images in to an animated image! Well, even with microsoft office, there are much easier ways of doing this. However, in these pages we are going to learn to do this super-easy using our new arsenal of tools plus one or two new ones.
Tools needed
We have most of them. Just need the following:
Check the presence of the above tools with the following commands:
$ dateshift -5.25 20060308 "+%Y%m%d %H:%M"
20060302 18:00
$gifsicle <file1>.gif <file2.gif> --loop > animation.gif
#where file1 and file2 are any two gif files that you can find.
The resulting animation.gif file should be 'animating' like this example.
TRMM Rainfall movie
We are going to create a movie showing the rainfall over the island of Sri Lanka during a number of consecutive days. We will not write much new code, just make some small additions to what we have already written.
Often data sources on the web do change. Since GFAS portal is a trial one as the time of writing (20060501), this is especially true for GFAS data. Always check around in the web, if in doubt.
- We use gfas-plot.bash as it is
- Several other standard commands in Cygwin like ps2epsi (if they are not installed, use cygwin setup.exe to install them.)
- The main script gfas-movie.bash is as follows:
#!/bin/bash
if [ $# -lt 2 ]; then
  cat << EOF
  Creates a movie with gfas rainfall.
  Usage: $0 YYYYMMDD N
  where YYYYMMDD is the start date (e.g. 20060304)
        N        is the number of days forward to process.
EOF
  exit 1
fi
tmpdir="unlikely$$dir"
rm -rf $tmpdir
mkdir $tmpdir
date=$1
nn=$2
ct=1
cd $tmpdir
cp ../sl-cities.txt .
while [ $ct -le $nn ]; do
  str=Rain1Day_02_$date
  echo "doing for $date, $ct, $str"
  echo "---------------------"
  wget --random-wait -nv -nc \
    "http://210.255.213.236/gfas%2Dweb/downloadf.asp?strFileName=$date&FName=$str.zip" \
      -O "$str.zip"
  unzip -o $str.zip
  mv AreaMesh02.Msh rain1day_02_20060421
     #the 'date' in this file does not mean a thing!
  ../gfas-plot.bash
  ps2epsi ss.ps ss.eps
  convert ss.eps $date.gif
  date=`dateshift 1  $date`
  ((ct++))
  echo "---------------------"
done
cd ..
#now let's make a gif animation
gifsicle -O2 --colors=32 --delay 20 `ls $tmpdir/*.gif` --loop > animation.gif
#you may want to remove the temporary directory later.
- Make sure that sl-cities.txt and gfas-plot.bash files are in the same directory.
- Run the script as (for example)
./gfas-movie.bash 20060320 40
to download data, plot individual frames and then join them to make a movie like this one!
Improvements
There are number of improvement that can be done to the above scripts. For example, it is very easy to plot the date in the title or below the figure, so that the image will be more informative. These are easy to implement by changing the basic scripts a little bit, so there is no need to describe them here.

