Difference between revisions of "Webapps with python"
| Line 35: | Line 35: | ||
To test this app, first find some images of concrete with and without cracks. For example: | To test this app, first find some images of concrete with and without cracks. For example: | ||
<gallery> | <gallery> | ||
File:concrete_crack_1.jpg|1 | [[File:concrete_crack_1.jpg|1]] | ||
File:concrete_crack_2.jpg|2 | File:concrete_crack_2.jpg|2 | ||
File:concrete_crack_3.jpg|3 | File:concrete_crack_3.jpg|3 | ||
File:concrete_crack_4.jpg|4 | File:concrete_crack_4.jpg|4 | ||
</gallery> | </gallery> | ||
Revision as of 18:48, 3 September 2019
Webapps with python

Python has a number of libraries that makes creating graphics based on data. Some of these tools can create interactive graphics and also web applications so that one can allow non-programmers to explore, analyse and visualize data. Ploty Dash is such a library with a particularly easy learning curve.
Here are some prototype applications that were created using this library. I use docker containers based on dokku -- a PaaS (Platform as a Service) --to host these apps.
Precipitation records of Europe
European Climate Assessment & Dataset project managed by Royal Netherlands Meteorological Institute (KNMI), collects meteorological data (pressure, humidity, wind speed, cloud cover and precipitation - see here for the complete description) from thousands of observation stations from (at the time of writing) 63 countries. As of september 2019, this database includes observations from 57312 stations.
We extracted the precipitation data from this dataset and provide it with a web application where the user can explore, do some simple trend analyses and download, downsampled data (Annual and monthly).
Life-cycle Costing Tool

One of the routine tasks of Infrastructure Asset Management is to calculate the 'total cost of ownership' of an asset, for example, a building, a bridge or barrage. This involves consideration of the cost of purchase or construction, annual operation and maintenance, periodic renewal and sometimes the ultimate cost of disposal. These costs are all brought to the present value (PV) and aggregated.
This app provides a convenient way to play with different cost components and interest rates (that is needed to calculate PV) and understand how that affects the whole life cost.
Orographic lift of wind fields - atmospheric quantities calculator

This is an educational tool to demonstrate the interaction of wind fields with mountains. The user can change the mountain height, humidity and temperature of the air and observe how they contribute to the formation of precipitation (liquid or sometimes ice/snow).
Urban population of the world

Using the curated dataset provided by simplemaps website, this plot shows the urban population of the world. Note: This dataset does not cover all the populated places. It covers almost all major cities and towns, but the coverage of smaller places could be uneven.
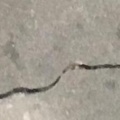
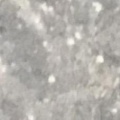
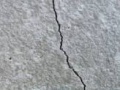
Concrete crack detection with CNN
In deep learning, a convolutional neural network (CNN) is a class of deep neural networks, most commonly applied to analyzing visual imagery.[1]
In this simnple demo example, I have trained a CNN with 40000 concrete images provided by [1].
To test this app, first find some images of concrete with and without cracks. For example:
2
3
4


- ↑ Lei Zhang , Fan Yang , Yimin Daniel Zhang, and Y. J. Z., Zhang, L., Yang, F., Zhang, Y. D., & Zhu, Y. J. (2016). Road Crack Detection Using Deep Convolutional Neural Network. In 2016 IEEE International Conference on Image Processing (ICIP). http://doi.org/10.1109/ICIP.2016.7533052